May 9th, 2022 | 3PL, eCommerce, Logistics, Order processing

Warehouse Reports and Dashboards

Shipment summary pie chart

Warehouse Reports and Dashboards

Shipment summary pie chart

Dashboards and reports are key elements of any warehouse management platform. Dashboards allow users who spend their whole day in the WMS environment to quickly identify what is going on in each area of the warehouse and determine what their current priorities should be.

Summaries of all the key operational areas

Ideally, when a user accesses the WMS desktop environment, they should land on a page that summarises the current and pending work relevant their role in the warehouse team. For warehouse managers and team leaders this will be a summary of all the key operational areas, the landing pages for other users might be focussed on the specific warehouse processes they are involved with.
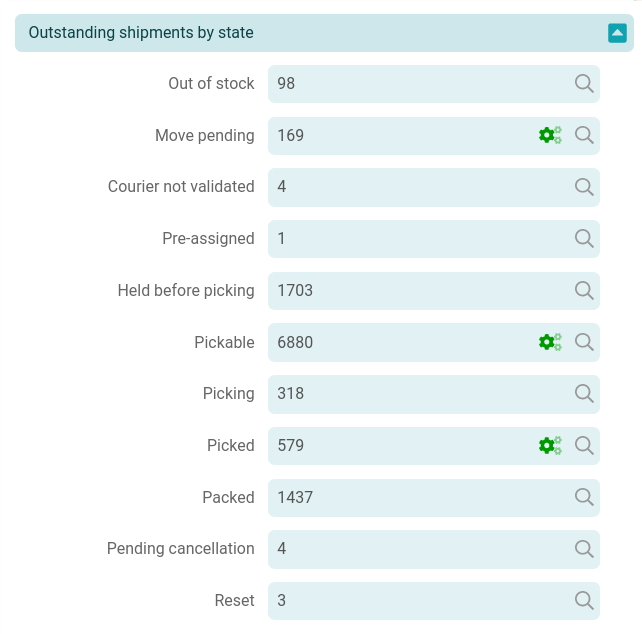
Shipment status summary dashboard

As users navigate through the WMS menu, they will generally move through area specific dashboards relevant to that operational area (picking, packing, goods-in, works orders, transfers, returns etc.). These dashboards should be configurable and should be tailored to the customer environment to reflect the priorities of the business.
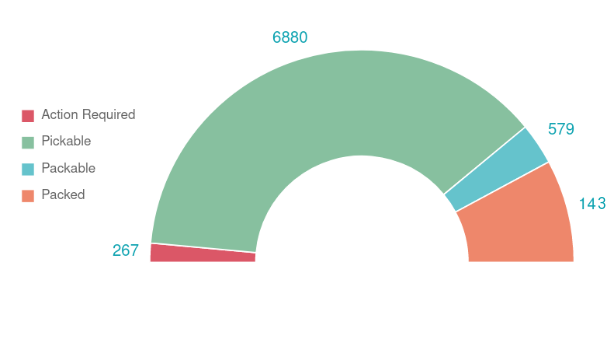
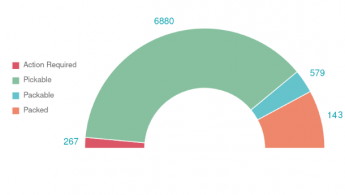
As users navigate through the WMS menu, they will generally move through area specific dashboards relevant to that operational area (picking, packing, goods-in, works orders, transfers, returns etc.). These dashboards should be configurable and should be tailored to the customer environment to reflect the priorities of the business.
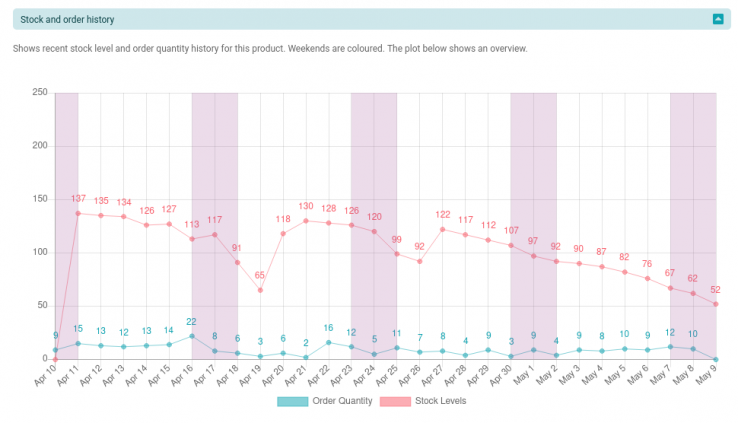
Identify all the exceptions and outliers that require particular attention

Dashboards should aim to give the user a quick overview of the pending work in the area they relate to and allow them to quickly identify all the exceptions and outliers that require particular attention. It’s important to strike the right balance between providing all the information that is relevant and not overwhelming the user with too much detail. The prominence you give to different key metrics within the WMS dashboards will influence how the team behaves. If same-day despatch is fundamental to your business then showing the packing team how many orders need to be packed before cut-off should be front and centre. If picking efficiency is important the average time taken to pick each order should be displayed to the picking team.

Reports are important for routine and ad-hoc analysis, in the same way that they’re important in all business applications. However, they can also be useful in a number of other different ways:

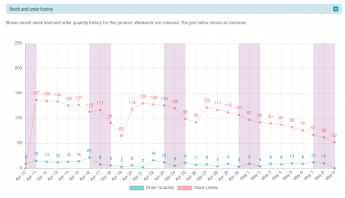
Stock and order history dashboard

Nudging users who don’t access the WMS on a regular basis

The warehouse team will often rely on WMS dashboards to tell them what they need to know. Other parts of the business that need to integrate with the warehouse (sales channels, customer service, accounts etc.) will supported through API integration between the different platforms. However, it’s often useful to be able to a more ‘lightweight’ mechanism to notify individuals of warehouse activity that they need to know about.

Ideally, WMS reports can be set up to run automatically and the report output to one or more email addresses. The email might contain text, web links to the relevant area of the WMS, or a file attachment. The reports can be configured to run automatically on a defined schedule but only send an email of the report actually returns results, making this a really useful way of checking for exceptions but only raising a flag when something is found.

Some examples of how this might be used are:

  • Sending the sales and/or buying teams alerts if the ratio of sales to returns increases significantly for an individual SKU or product range.
  • Sending the eCommerce team an alert if the API interface with the eCommerce sales channel starts reporting errors.
  • Sending the sales and/or buying teams alerts if the orders received for a particular SKU or product range suddenly changes beyond a defined threshold (e.g. more than a 20% change on the previous week).

Saving ‘snapshots’ of key information at a defined point in the day, week or month

It is often useful to use reports to capture a snapshot of a particular aspect of the WMS environment at a defined point in time and save the results. A WMS should allow the report output to be saved within the WMS environment or automatically exported to an external FTP server or file system.

Some examples of how this might be used are:

  • Saving a snapshot of the WMS stock position at the end of every month for use by the accounts department.
  • Saving a monthly summary report of user productivity metrics for use in performance reviews.
  • Exporting end of day summary reports to FTP server where they can be accessed by users outside the WMS environment.
  • Exposing information to external systems

A good WMS should allow any report to be invoked by third party systems through the WMS API. The API request can include search parameters that can be passed into the report. This provides a secure, lightweight mechanism for exposing WMS data to third party systems in situations when a more complex integration is unnecessary.

Some examples of how this might be used are:

  • Allowing a customer service platform to pull the available stock level for a specific product or the status of a specific customer order from the WMS in real time.
  • Allowing external business dashboards that display information from different platforms across the organisation to pull summary information from the WMS.
  • Defining summary dashboards that can be displayed from within the WMS phone app and made available to users when they are away from the warehouse.

Tailoring your WMS dashboards to reflect the priorities of your business and to display the metrics you are most interested ensures that your warehouse team focus on the key performance indicators that will make the biggest impact on your business.

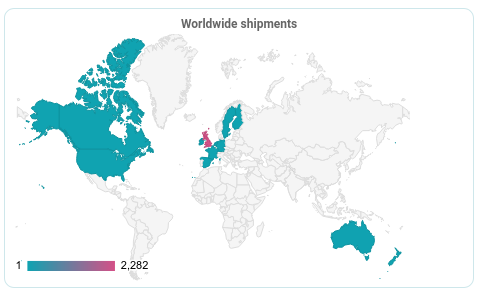
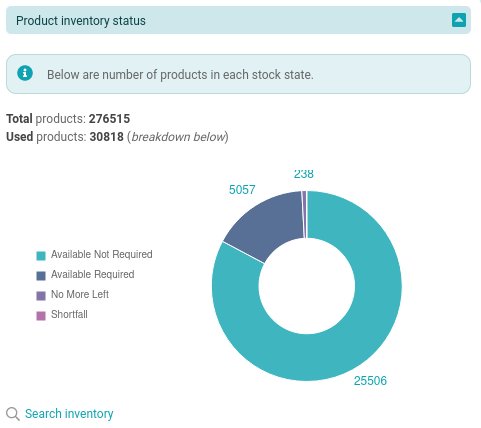
Shipment volumes by countryProduct inventory graphic

Exposing information to external systems

A good WMS should allow any report to be invoked by third party systems through the WMS API. The API request can include search parameters that can be passed into the report. This provides a secure, lightweight mechanism for exposing WMS data to third party systems in situations when a more complex integration is unnecessary.

Some examples of how this might be used are:

  • Allowing a customer service platform to pull the available stock level for a specific product or the status of a specific customer order from the WMS in real time.
  • Allowing external business dashboards that display information from different platforms across the organisation to pull summary information from the WMS.
  • Defining summary dashboards that can be displayed from within the WMS phone app and made available to users when they are away from the warehouse.

Tailoring your WMS dashboards to reflect the priorities of your business and to display the metrics you are most interested ensures that your warehouse team focus on the key performance indicators that will make the biggest impact on your business.

Your reputation is everything

Custom reports will allow you to assess the impact of incremental improvements but can also play a useful role in ensuring other areas of the business have the information they need about any aspect of the warehouse operations that they need to be involved with.

Reputation is everything in warehouse distribution and order processing and making sure your WMS is up to the task is now crucial to any businesses ongoing success.

If you’d like to know more about OrderFlow, please get in touch with Charlie Armor or Douglas Myatt